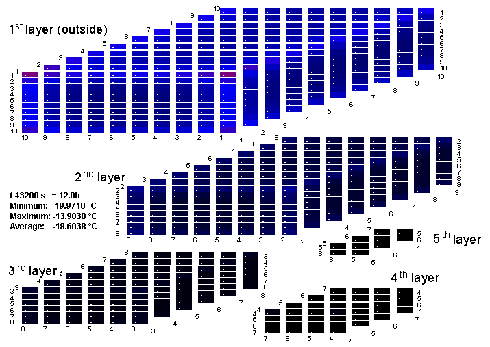
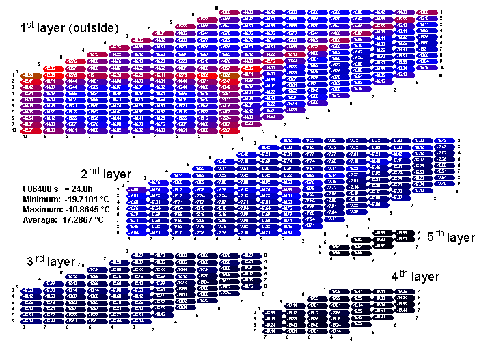
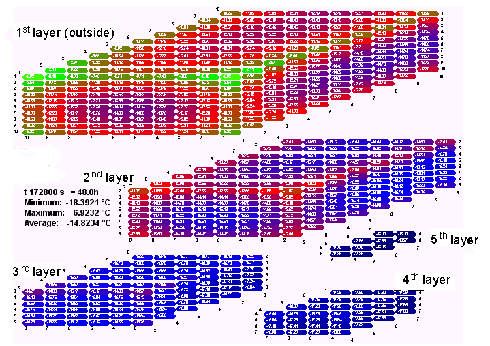
The simulation carried out here used a 20' container divided into 10 x 25 x 10 elements, with each element being a cube with an edge length of approximately 24 cm. The period of time for each calculation step was 60 seconds. The simulation made the assumptions described in the example for rule of thumb calculations given above.
The results of this calculation are shown in the following figures for 12 hours, 24 hours and 48 hours without refrigeration. The average increase in temperature after 48 hours is 5.2 K and is thus just below the figure calculated using the rule of thumb. This effect comes from the fact that rapid warming of the outer layers of the load reduces the temperature difference to the environment thus less heat enters through the insulation.
It can be clearly seen that the most exposed locations in the container increase in temperature most rapidly. These are the top corners of the container. After 12 hours, the increase in temperature here is already 7.0 K, after 24 hours it is 9.2 K, and after 48 hours it is as much as 13.1 K. At the same time the core of the load has increased in temperature by just 1.6 K even after 48 hours.
 |
| Click on graphic to enlarge. Figure 48: Calculated temperature distribution in the container after 12 hours; initial internal temperature -20°C, external temperature +20°C |
 |
| Click on graphic to enlarge. Figure 49: Calculated temperature distribution in the container after 24 hours; initial internal temperature -20°C, external temperature +20°C |
 |
| Click on graphic to enlarge. Figure 50: Calculated temperature distribution in the container after 48 hours; initial internal temperature -20°C, external temperature +20°C |
The precise degree to which the temperature of the top corners of the stowed goods increase compared with the average temperature rise will depend very much on the thermal conductivity of the block of goods. The following principle applies: The greater the stowage density of the goods, the more uniformly the temperature of the goods increases. This is because a low stowage density indicates that there is a higher proportion of air in the packaging since the actual density of the goods is almost always the same because of their high water content. The air contained in the packaging acts as an insulator which hinders the transfer of heat from the outer layers to the inner layers.
Generally this calculation indicates clearly that even a relatively short absence of the refrigeration system, for example, a single day, can lead to significantly increased temperatures in the exposed sections of the load. Thus if data loggers are used in the cargo it is of great importance where in the container they are located.