| Year | Insulated TEU |
Integral TEU |
Total TEU |
Source | Increase in integrals per year |
| 1978 | 53,260 | 52,291 | 105,551 | Containerisation International World Container Census 1999 | |
| 1982 | 72,184 | 110,710 | 182,894 | Containerisation International World Container Census 1999 | 20.6% |
| 1986 | 77,065 | 157,039 | 234,104 | Containerisation International World Container Census 1999 | 9.1% |
| 1990 | 71,505 | 282,265 | 353,770 | Containerisation International World Container Census 1999 | 15.8% |
| 1992 | 73,491 | 333,461 | 406,952 | Cargoware International Dec. 1992 | 8.7% |
| 1994 | 70,973 | 449,726 | 520,699 | Containerisation International World Container Census 1999 | 16.1% |
| 1995 | 71,888 | 519,684 | 591,572 | Containerisation International Jan. 1996 | 15.6% |
| 1996 | 64,187 | 566,657 | 630,844 | Containerisation International World Container Census 1999 | 9.0% |
| 1997 | 60,962 | 623,822 | 684,784 | Containerisation International World Container Census 1999 | 10.1% |
| 1998 | 57,477 | 696,419 | 753,896 | Containerisation International World Container Census 1999 | 11.6% |
| 2002 | 37,000 | 1,050,000 | 1,087,000 | Containerisation International World Container Census 1999 | 10.8% forecast |
Table 4:
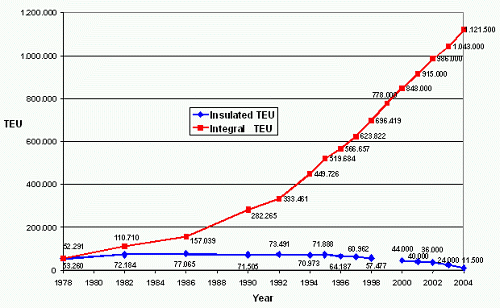
Overall trends in refrigerated container quantities from 1986 through 1998
 |
| Figure 27: Overall trends in refrigerated container quantities from 1978 through 2004 |