Fig. 12 shows the daily amplitude in goods temperatures measured within the stack of a container packed with sugar on a sunny day in June: the daily amplitude in the interior of the stack is only 1.2°C, while that for the superficial layer is 6.3°C (see Fig. 12).
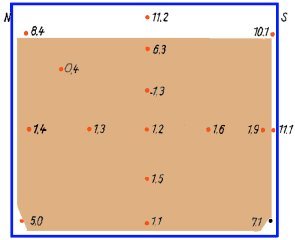 |
Figure 12: Temperature differences over 24 hours within the stack of a container packed with sugar in sales packaging; U. Scharnow [42] |
This means that the temperature in the interior of a stack of cargo adapts to changing external temperatures only very slowly. It is clear from these measurements how far the interior temperature of the goods lags behind changes in external air temperature caused by changes in weather conditions (see Fig. 13).
 |
| Figure 13: Measured air and goods temperatures at different times of day in a container packed with 16 metric tons of white sugar on a sunny day in June a) at 06:00, b) at 14:00 and c) at 18:00; U. Scharnow [42] |
The exposure of the goods to thermal stresses is determined by the size of the stack and its internal compactness. Stacks which are so dense that the ambient air cannot freely circulate within the stack do not readily adjust to external temperatures and water vapor also cannot be dissipated. Considerable delays may be observed even with this comparatively small stack in the container. The daily variation in temperature of a packed cargo is less marked. Although none of the cargo is more than 1 m away from a boundary surface of the cargo stack, the daily variations in air temperature in the container have, as can be seen, only a very gradual impact on the daily variation in goods temperature in the interior of the stack.
A different temperature regime is to be anticipated in a container which is completely filled with goods than in an empty or partially filled container.
Fig. 15 shows, for example, the frequency distribution of overheating in two differently loaded containers. While M 11 was obtained in a container packed with 16 metric tons of sugar (see Figs. 12 and 13), M 2 was simultaneously obtained in a container packed with 1.75 metric tons of bagged sawdust (see Fig. 15) which occupied approx. 30% of the container volume. The differences in humidity were still more extreme. While the sugar container did indeed also constantly exhibit comparatively high relative humidities of 70 - 80%, no appreciable sweating occurred and, after 6 months' storage, the sugar was unpacked again in perfect condition, whereas severe sweating was constantly observed in the sawdust container.
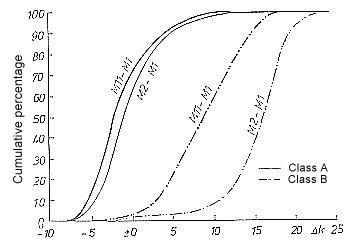 |
Figure 15: Frequency distribution of overheating in two differently loaded containers; U.Scharnow/Svenson [41] |