Some fundamental product information issues need to be brought to mind for the following explanations.
Air always contains a certain proportion of water vapor, approx. 3 g/m³ in cold, dry air, as much as 30 g/m³ in warm, humid air. This is only a small proportion, amounting to at most 3% of the mass of the air, but has a considerable meteorological impact, as is clear from the day to day changes in the weather.
Decisively, the atmosphere can only contain a certain quantity of water vapor, the saturation content, which is dependent upon temperature. The hotter is the air, the more water vapor it may contain.
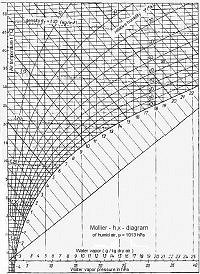
| Figure 1: Mollier h/x diagram (Click on graphic to enlarge) |
Once the saturation content is reached, no further water can evaporate. Relative humidity is now 100%. A relative humidity of 60% means that air contains 60% of the saturation content.
The lower the rel. humidity, the more intensively does water vapor adsorption proceed, so bringing about a drying action.
One clear parameter which indicates the risk of sweat formation is the dew point temperature of the air. This is the temperature at which the water vapor contained in the air reaches its saturation content and, if cooling continues, condensation occurs.
If the dew point temperature is known, it is possible to estimate the risk of sweat. The interrelationships between these variables are presented in diagrams. Fig. 1 shows a Mollier h/x diagram which is very well suited to such conversions.
The temperature values, i.e. air and dew point temperature, can be read from the Y-axis, while the mixture ratio x (g/kg) can be read from the X-axis. The mixture ratio x states how much water vapor one kilogram of dry air contains.
The curves running from the bottom left to the top right indicate the relative humidity in 10% increments. The bottom curve applies to a humidity of 100% and is thus known as the saturation curve. The position of a given mass of air within these coordinates must always be defined by at least two values, one of which should always be the air temperature. The second coordinate is then determined by the mixture ratio x, relative humidity or by the dew point.
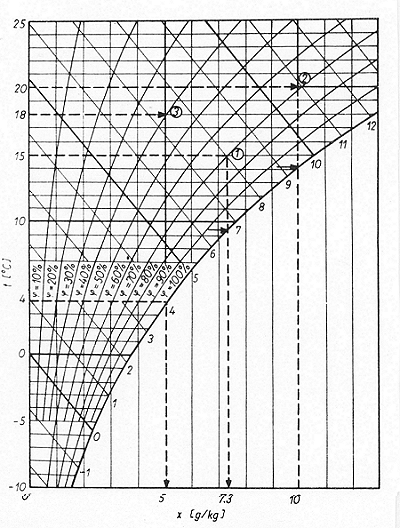
Fig. 2 shows examples of the use of a Mollier h/x diagram.
 |
| Figure 2: Examples of the use of a Mollier h/x diagram [46] |
The following three examples show how, starting from the known values, the others are determined. All the points from which the results are read off are indicated with an arrow in the Figure.
Example 1:
The air temperature t = 15°C and
relative humidity φ = 70% are known;
Root: the mixture ratio x and dew point
Result: x = 7.3 g/kg
Example 2:
The air temperature t = 20°C and
mixture ratio x = 10 g/kg are known;
Root: relative humidity φ and dew point
Result: φ = 69%
Example 3:
The air temperature t = 18°C and
dew point
Root: relative humidity φ and mixture ratio x.
Result: φ = 39% x = 5.0 g/kg
